Kubernetes logging
If you use Kubernetes for any length of time, you will come to realise that when everything is working, it’s brilliant - and when it’s not, it’s entirely impenetrable. Figuring out what’s going on means digging through dozens of different services, all in their own containers, and trying to work out where the interactions are failing…
Without a good centralised logging service, you are basically doing this blind. I would say the single most critical thing you can do immediately after you install your Kubernetes cluster, is wire it up to a logging service, so that you are capturing somewhere the output of every one of those containers. Do it, do it now!
Which service do you recommend?⌗
Well, I’m glad you asked. In the real world, where I get paid for this stuff, we have used a variety of systems over the years, but the main one we’ve settled on is the now-venerable ELK (ElasticSearch, Logstash, Kibana) stack. It works well, and offers a great deal, but I have to say personally I feel it adds rather a lot of overhead/complexity for a simple solution. We’ve also found that Grafana Loki is a good solution, which combined with Prometheus and Grafana itself makes it easy to bring your logs and application/system metrics together into a single dashboard. Dare I say it, I think I actually prefer it to ELK.
Neither of those solutions is really appropriate for collecting logs from my simple Kubernetes cluster, though. The simplest way to deploy either of them is with a Helm chart onto Kubernetes itself, but there is something unpleasantly recursive about storing all the logs that will help me debug the cluster on an application hosted on the cluster itself. More pragmatically, given the somewhat underpowered nature of my cluster, probably 80% of the cluster’s processing capacity would be spent on the logging service.
No, I needed something simpler…
Silver Linings⌗
What I needed for this is a cloud service provider, that can do a simple job - give me an endpoint I can dump all my logs to, and then a nice web UI that lets me view them live, as well as searching through and filtering them. Being able to graph the rate of messages, as well as setting up automatic alerts, are nice to haves.
This is far from a unique requirement. But it’s also far from cheap - there are many services out there that can do the job, often combined with APM (Application Performance Monitoring) and system monitoring services; but what most of these services have in common is being prohibitively expensive for someone who is “just playing” or using them for hobby purposes.
An aside: This is something that actually really annoys me about many Cloud service providers. If you hide your prices away behind a “call our sales team” number, or if your cheapest tier is priced in tens-of-dollars-per-host, then I’m just not going to look at your service. And that’s a shame for you, because when it comes down to renewing the half-a-million-euro contract for APM services I have in my day job, I’m not going to know how cool your product is from my experience at home.
The really good Cloud providers, like Google, Cloudflare or even AWS, let techies sign-up, and actually use their services for real (if small scale) projects on a pay-as-you-go basis without getting on the hook for thousands of dollars of minimum fees. They know that by doing this, they’ll earn tens or hundreds of thousands more by building awareness and expertise of their services among the people who used them in a hobby project, but then went on to use them professionally.
Anyway, ranting aside, after look through several such services, I did eventually settle on one that does the job, is simple to set up, and is also reasonably priced.
Solarwinds⌗
Solarwinds appears to be one of those companies that has grown by acquiring all the other companies that looked like they were cool at some point, and so have multiple, overlapping products that share the same brand name but are otherwise entirely different. Accordingly, they are able within a single company to represent both the worst and the best of cloud service provision, for basically the same product.
At the “worst” end of the scale you have Loggly. Seriously, don’t even sign up for this - it’s a nice product, and it works well enough, but the instant you register for a free trial you can expect to be spammed with increasingly passive-aggressive emails from sales people. I mean seriously, within three days of registering on their site, I had received three emails, and we’d already got to this stage of neediness:
Hi Tim,
As I haven’t heard back, I’m still trying to figure out how to help you. Are you looking at Loggly for your production environment? Current development purposes? One-off project? […]
It’s been three days since I first stumbled on your website and we’re already at the “as I haven’t heard back” stage? Damn, I’m glad we didn’t meet on Tinder, Loggly.
Papertrail⌗
But, I don’t want to talk about my abusive relationship with Loggly. Because Solarwinds also have a product at the other, good, end of the spectrum: Papertrail. It does one thing - consolidating and exposing logs - well, no salespeople will call, and it’s reasonably priced. For $7/month, paid monthly, you can upload 1GB worth of logs, which will be searchable for a week and retained for download for a year. And if you need more than that (it’s plenty for my little cluster), you can set up your own plan entirely at your own control from the dashboard. And, in a nice touch, if you have some system that’s stupidly chatty and you really don’t need to see everything it is saying - you can set up filters to remove those loglines before they impact your plan limits.
So, the short version of this story is - use Papertrail. It does the job, it’s cost-effective, and it’s easy to integrate with Kubernetes.
Easy to integrate?⌗
Aha, so this is the interesting bit. So, you’ve chosen your logging provider, now how do you integrate it with Kubernetes?
Well, the first thing you need is some kind of log-aggregator that runs on your Kubernetes nodes. It needs to collate all the logs from all the running pods, and then send them someplace (in my case, to Papertrail.)
There are many options for this component, but the simplest I’ve found is
Logspout. As the readme.md says:
Logspout is a log router for Docker containers that runs inside Docker. It attaches to all containers on a host, then routes their logs wherever you want. It also has an extensible module system.
It’s a mostly stateless log appliance. It’s not meant for managing log files or looking at history. It is just a means to get your logs out to live somewhere else, where they belong.
Because Logspout is ‘docker native’, all we need to do is spin it up on each of our Kubernetes nodes, and the rest pretty much happens by magic.
How do we spin some application up so that it runs on every node of our
Kubernetes system? With a DaemonSet deployment, of course! This is what
the deployment YAML looks like, to run Logspout up, and then send all my
logs to my Papertrail account:
apiVersion: apps/v1
kind: DaemonSet
metadata:
  labels:
    name: logspout
  name: logspout
  namespace: default
spec:
  selector:
    matchLabels:
      name: logspout
  template:
    metadata:
      labels:
        name: logspout
    spec:
      containers:
        - env:
            - name: SYSLOG_TAG
              value: '{{ index .Container.Config.Labels "io.kubernetes.pod.namespace"
            }}[{{ index .Container.Config.Labels "io.kubernetes.pod.name" }}]'
            - name: SYSLOG_HOSTNAME
              value: '{{ index .Container.Config.Labels "io.kubernetes.container.name"
            }}'
          image: mdsol/logspout:latest
          imagePullPolicy: IfNotPresent
          args:
             - "syslog+udp://mypapertrailendpoint"
          name: logspout
          resources:
            limits:
              memory: 128Mi
            requests:
              cpu: 150m
          volumeMounts:
            - mountPath: /var/run/docker.sock
              name: log
      restartPolicy: Always
      volumes:
        - hostPath:
            path: /var/run/docker.sock
            type: ""
          name: log
The only thing you need to replace there to make this work with your own
system is to change mypapertrailendpoint with the hostname and port number
that you’ll find in your Papertrail account dashboard (Settings > Log Destinations).
I deploy this to my Kubernetes environment with kubectl apply -f, and as if
by magic, all my logs appear in one simple online dashboard:
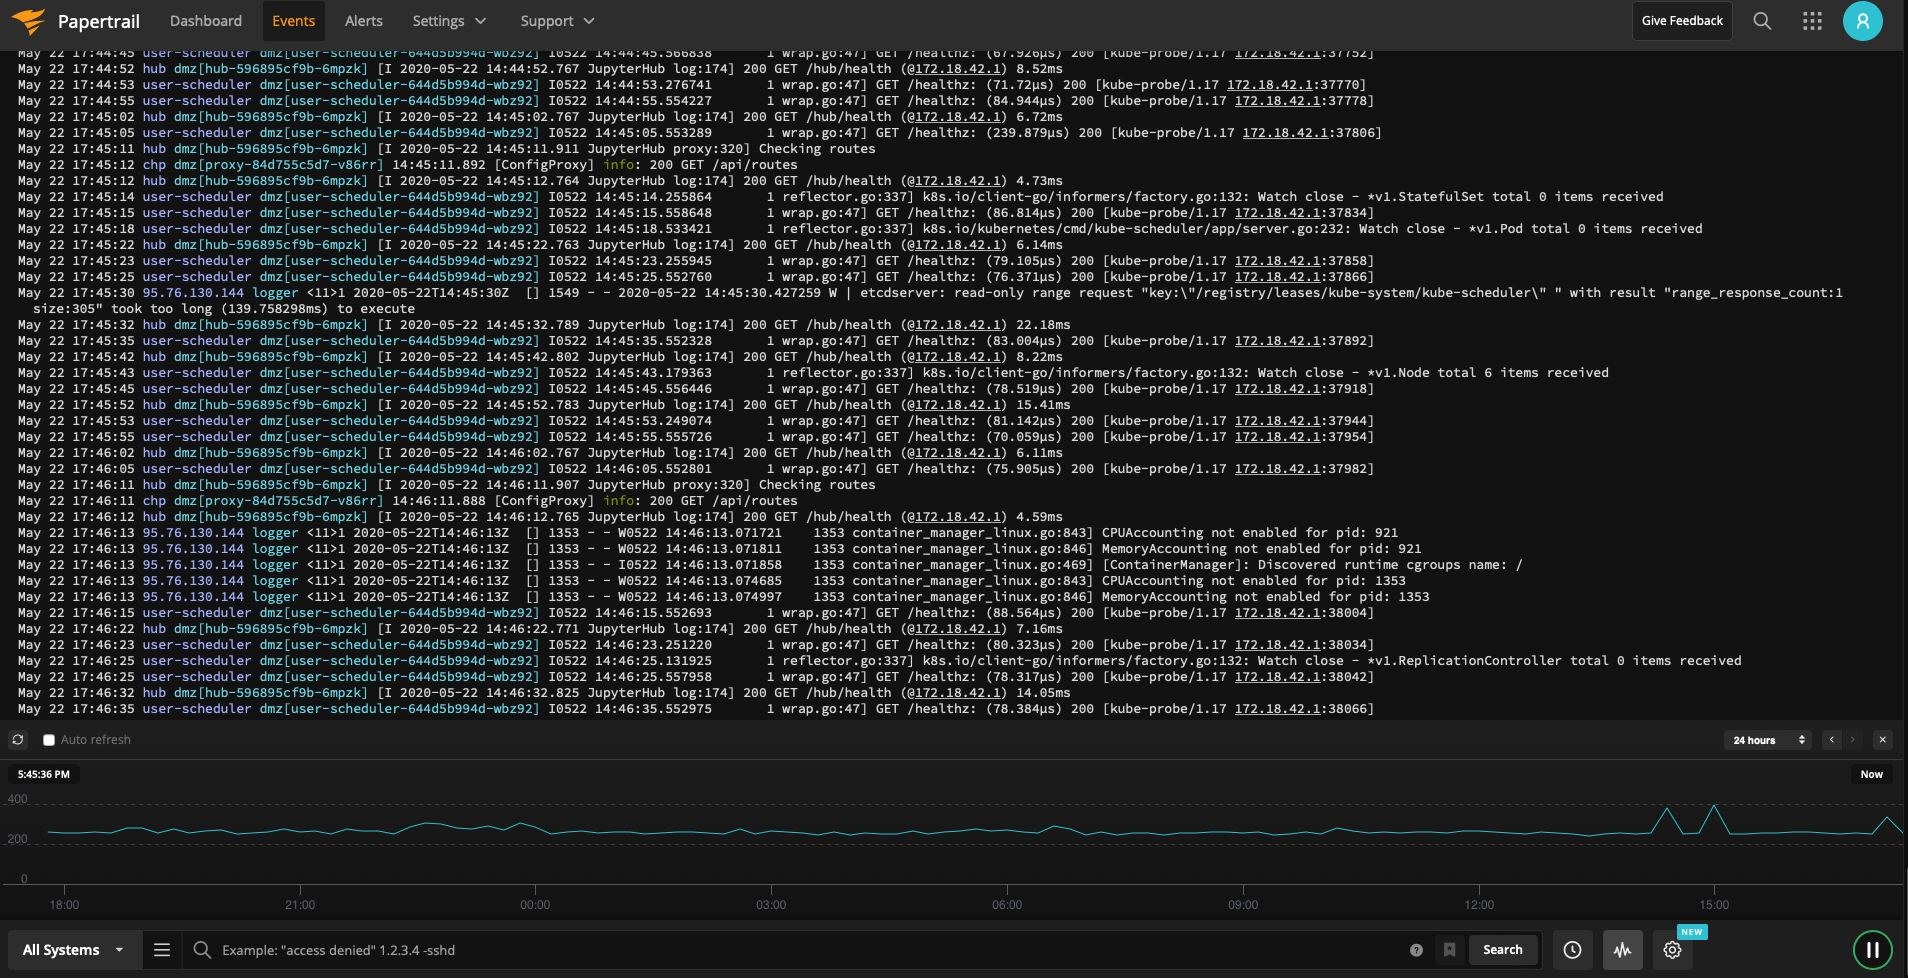
And that, pretty much, is that.
An Important Caveat⌗
I am using a syslog+udp endpoint here. I’m doing that because it’s incredibly
simple (and I’ve said before, I like simple.) It’s also bandwidth efficient;
there are two factors you need to consider though:
| Issue | Explanation |
|---|---|
| UDP is unreliable | UDP messages are basically sent fire-and-forget; hopefully it’s received, but if not, it’s just lost. For my purposes, this is fine - and I appreciate the lack of overhead associated with creating a TCP connection for reliable delivery. |
| UDP is insecure | There is no encryption happening here - your data is sent plain-text across the Internet. Anyone sniffing your traffic will be able to see it. For my purposes, this is not an issue - but if I ever start logging things that could contain sensitive data (personal details of, well, anyone - letalone things like credit card numbers), UDP is no longer acceptable. |
The solution in both cases is to switch to an encrypted, TCP endpoint. Papertrail supports TLS-encrypted TCP connections, so this is easy enough to do. Why haven’t I? UDP just doesn’t get enough love, I guess…